
Headroom: The Private Finance Overview School Never Gave You#

You learned the volume of a cone. Nothing in your life since has been a cone.
Thirteen years of school, and nobody once put a payslip on the projector. Nothing about how to structure a budget, how much to put aside and into what kind of account, or how a mortgage payment splits between interest and the part that is actually yours. Nor what your salary is worth after tax, what you cost the company paying it, or how to tell when you are being ripped off.
The numbers sit in a bank app, a fund account and a pension portal, and nothing adds them up. The apps that offer to fix that want your bank login and a monthly fee.
Headroom is that overview, and it is not another SaaS. Open source and free, one container on your own machine, no account and no subscription. What is mine after tax and debt, what I can spend today, whether my salary is keeping up, and where this lands in fifteen years.
Drop a ⭐ on headroom if it is useful. The manifests that run it live in my Homelab repo.
mortennordbye/headroom A self-hosted personal finance tracker for budgets, assets, investments, and loan modeling. Dockerized with local SQLite storage.headroom.nordbye.it is a showroom, not a service. Click every page and change every number you like. It runs on invented data, nothing you type is saved, and the server refuses every write. To actually use it, run your own copy.
Why It Is a Container and Not a Subscription#
The obvious version of this is a SaaS. Sign up, connect your bank, 79 kroner a month.
Most people want that data to stay theirs, and I have no interest in holding it. So it is one container and a database file you own. It is all just maths anyway, and putting a monthly fee in front of maths means the people who need it most never see it.
Built for Norwegian Money#
This started as a Google Sheet with my budget in it. It grew tabs, then formulas pointing at other formulas, and writing an app became less work than fixing the spreadsheet again.
So the rules underneath are Norwegian. Real brackets, real rates, and the awkward details like holiday pay being earned one year and paid the next. Tuned as well as someone with no financial education can manage.
Everything around that is generic. Switch the region to generic and the tax rules collapse to one flat rate you type in yourself. For your own country, the seam is one fork in the tax calculation and a table of brackets. Open a PR and we get it shipped.
The Dashboard#
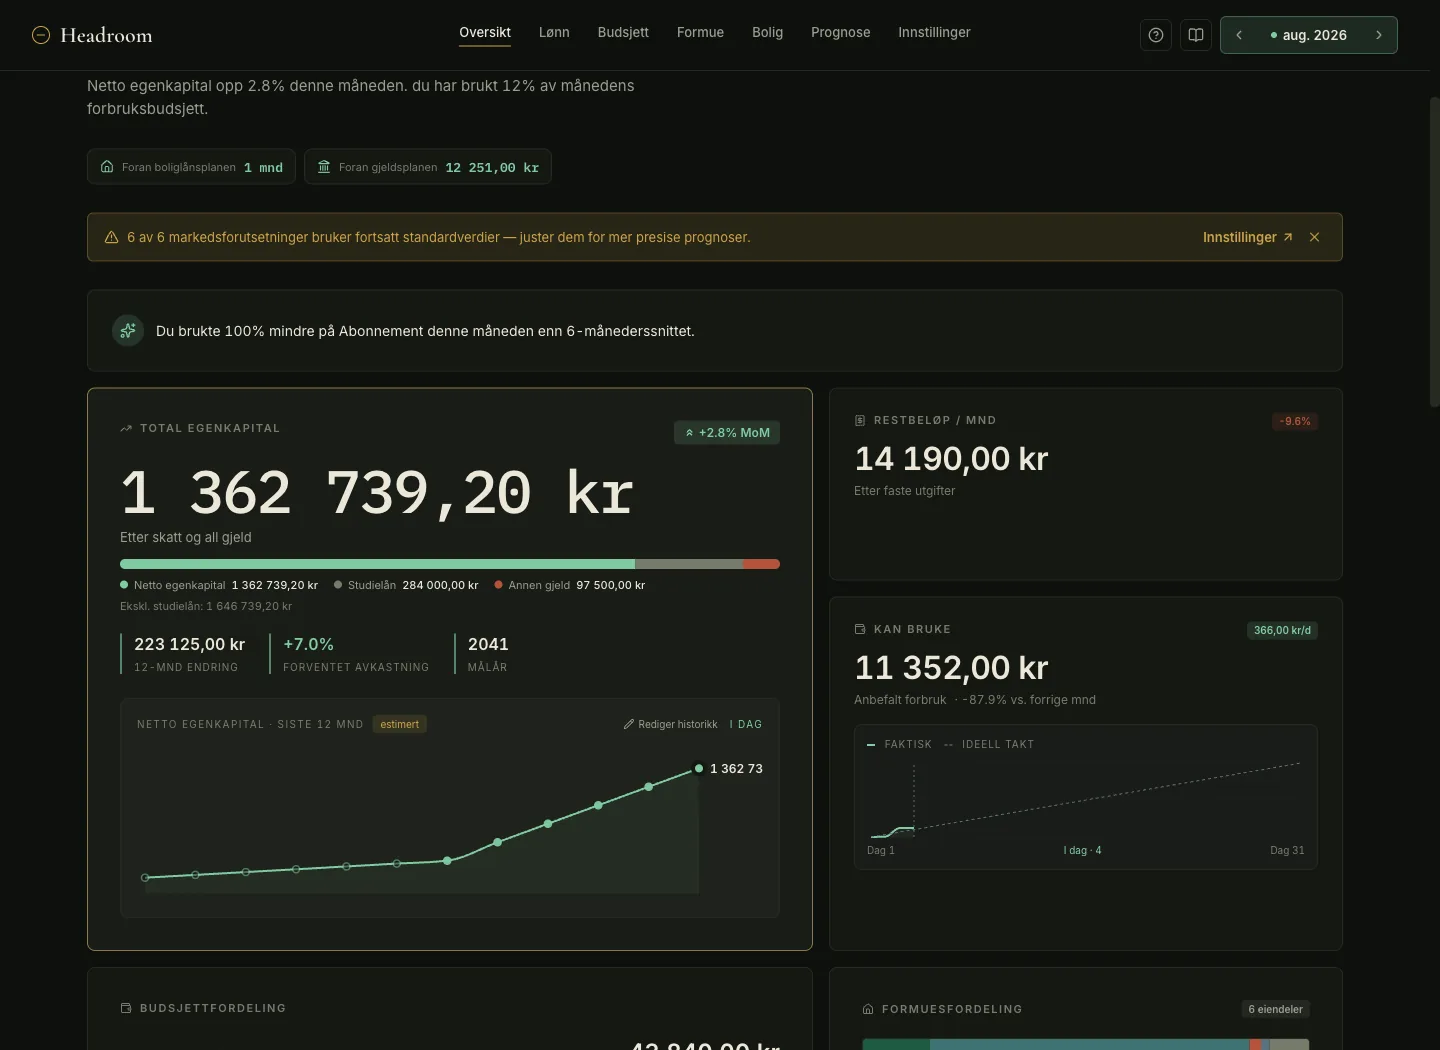
The front page is every other panel in one view, and which way each one is moving. Equity after tax and all debt, what is left of the month at 366 kr a day, and goals reading their own balances.
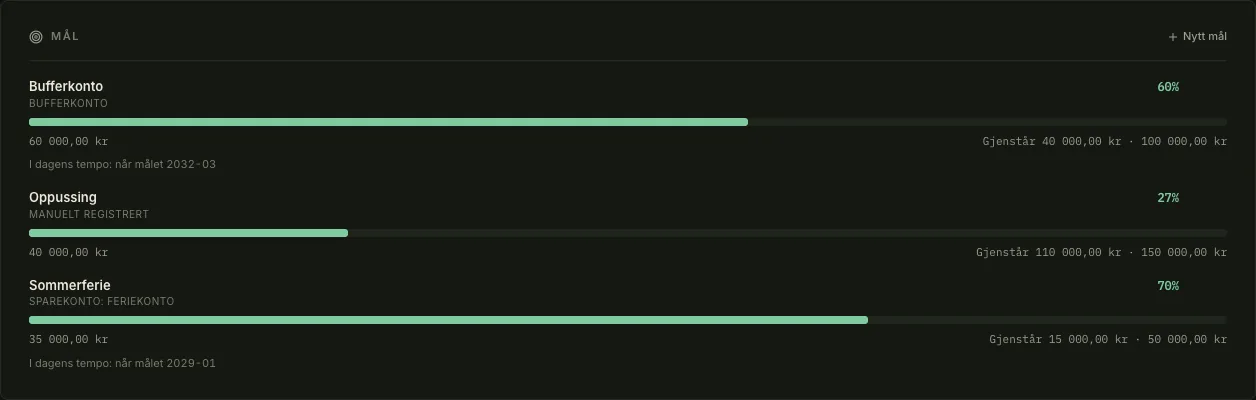
Each goal carries the date it lands at the rate it is actually growing. The buffer reaches 100 000 in March 2032, and with a deadline set it says how far behind that is and what the monthly amount would have to be.
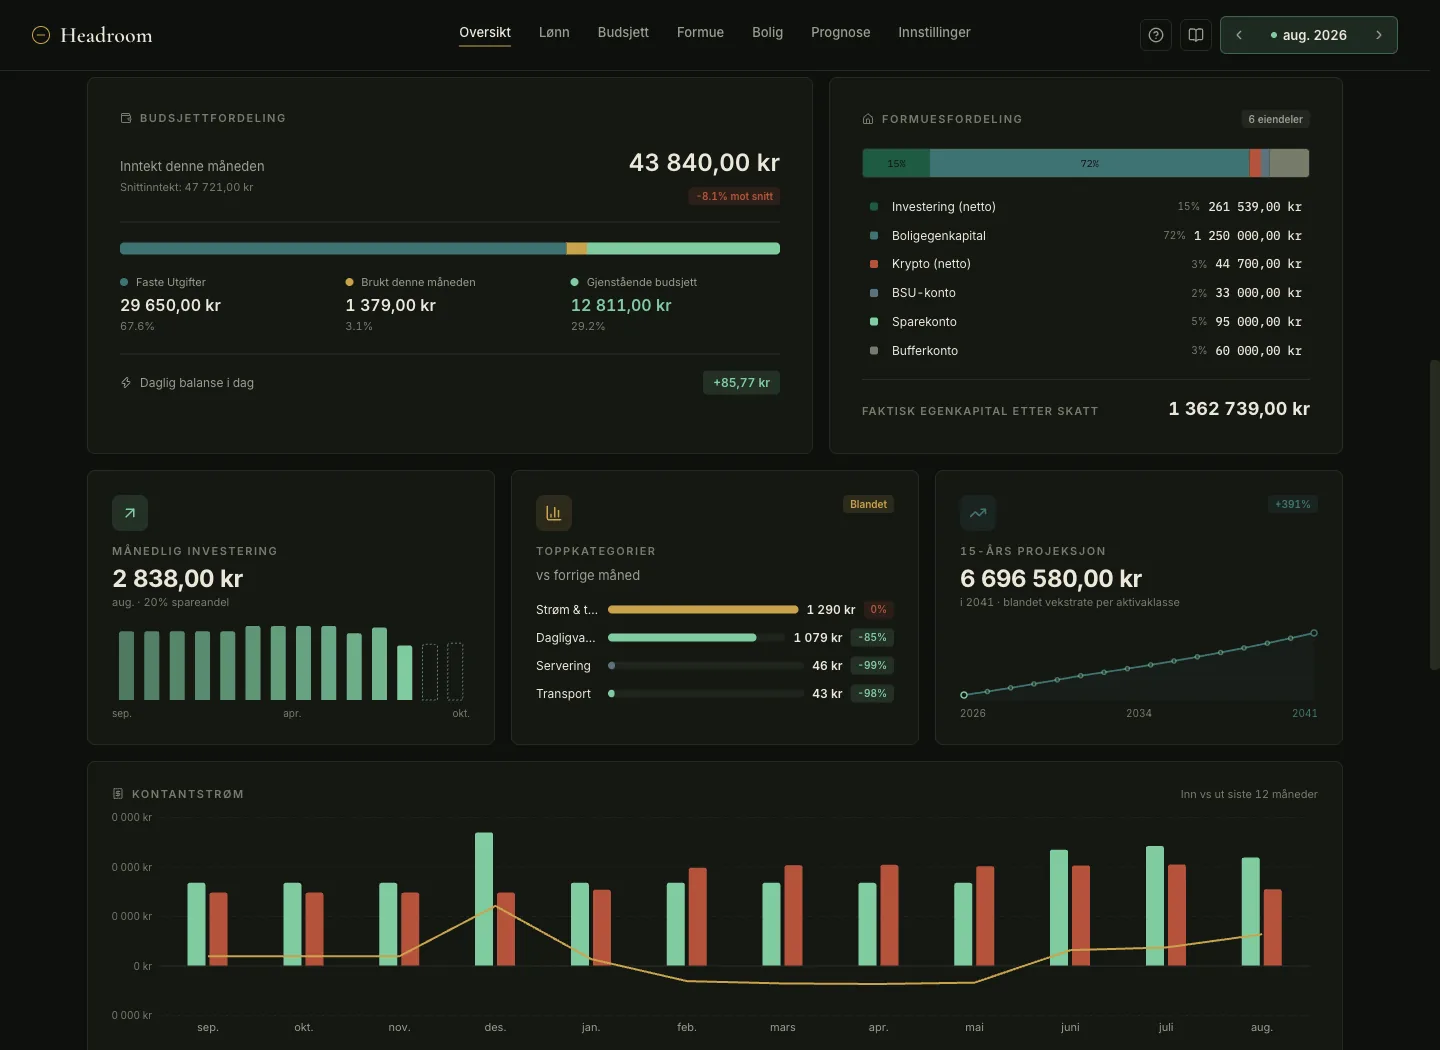
Underneath, where the equity sits, emergency fund coverage in months of fixed expenses, and debt-to-income against the 5x cap.
Your Career, Written Down#
Data is power, and salary is where that pays off. Take enough of your own history and context into the room and you are far less likely to get stuck on a number someone else picked.
The Raise That Is Actually a Pay Cut#
If you open one page in the demo, open this one.
A raise below inflation is not a raise. It is a pay cut delivered as good news, and it works because nobody does the subtraction in the room.
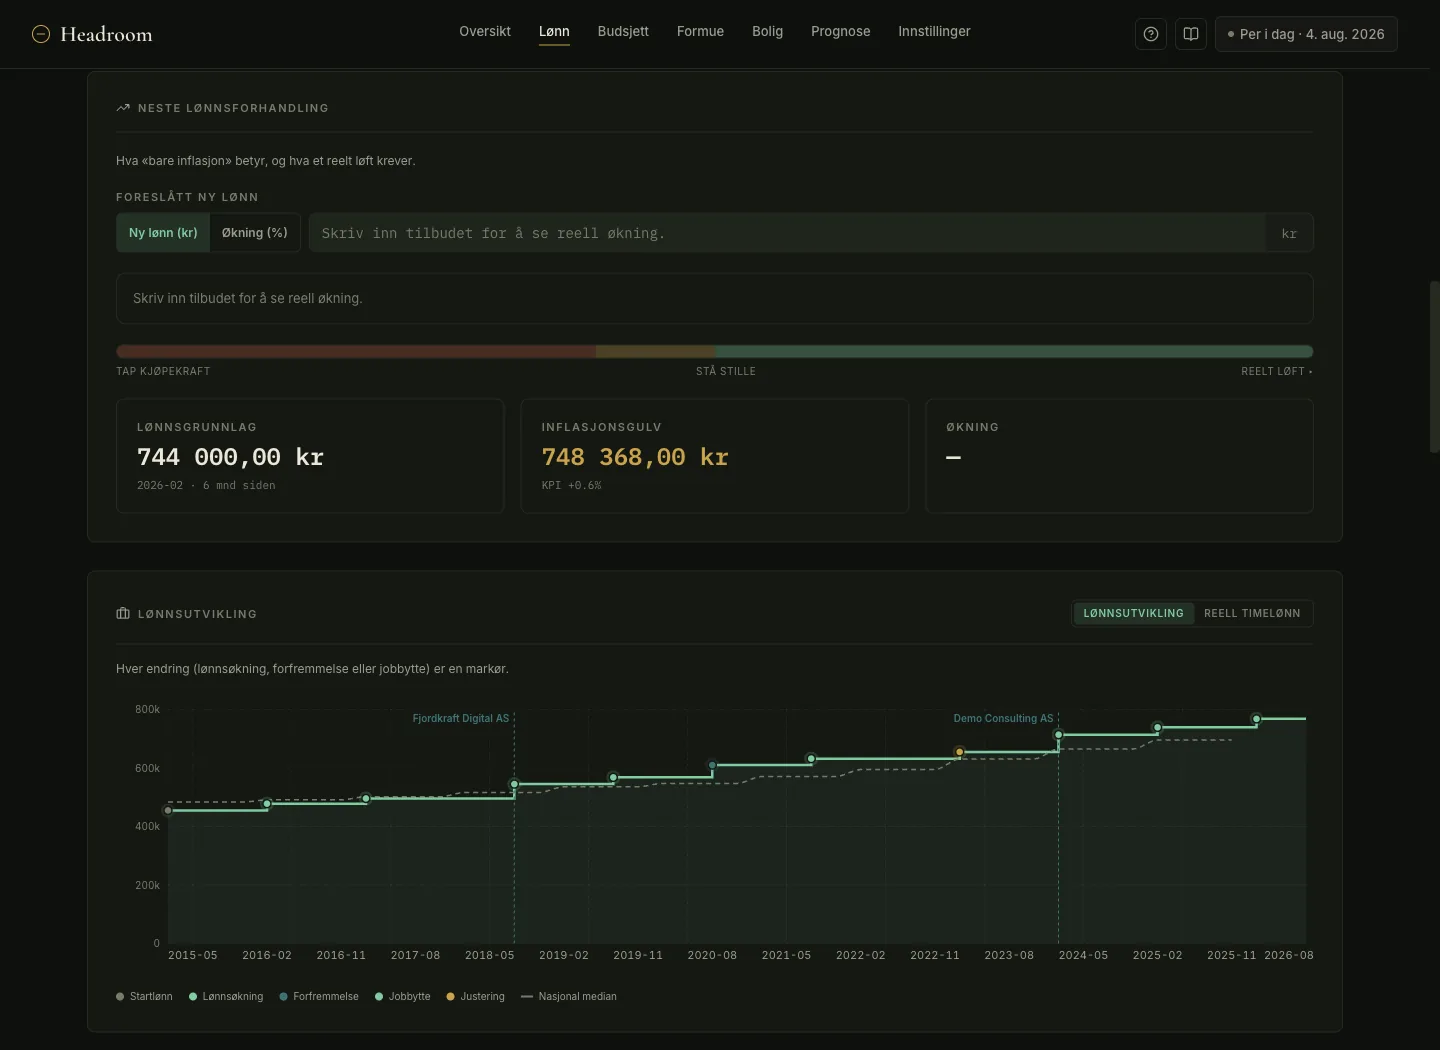
Your salary was set in February at 744 000 and prices moved 0.6% since, so the offer has to clear 748 368 before you have gained anything. Type a number, as kroner or as a percentage, and the bar tells you which of three things you just accepted.
That is the floor, not the ask. What you take into the meeting is the rest of the page. Growth against CPI for every year you have logged, where you sit against the median, and what your effective hourly did while your title changed twice.
The alternative is arguing from memory against someone who has the numbers in front of them.
Ten Years of Entries#
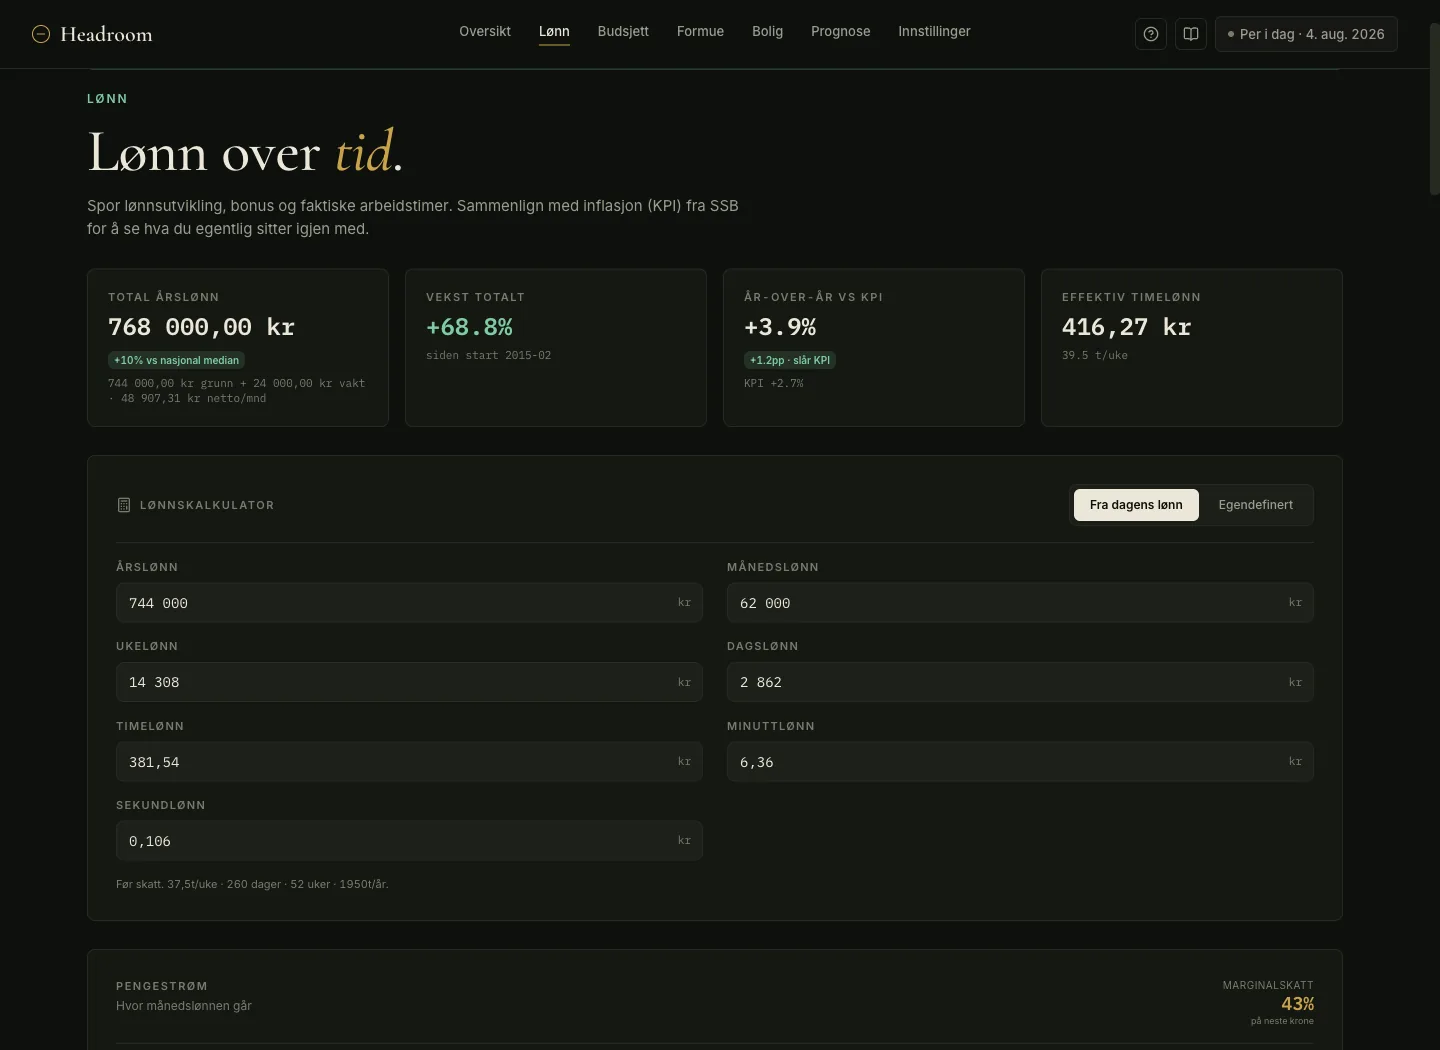
The salary page is a log you keep for a decade. Jobs, roles, contracted hours, and every salary change with a date and a type. Bonuses, overtime and hours actually worked go in separately, because a year where you got 3% and worked 15% more is not a good year.
In the demo that reads 768 000 gross, up 68.8% since 2015, 3.9% this year against 2.7% inflation, and 416 kr an hour, ten percent above the national median from SSB.
The charts turn ten years of entries into an argument. A marker on every change, one bar per year against CPI, total comp stacked so a vanished bonus is not read as a cut to the base, and hours against hourly rate.
Effective hourly is the one that stings. A 5% raise that arrives with four extra hours a week is a pay cut per hour, and nothing on your payslip will tell you.
There is also a calculator that divides your salary down to the second. 0,106 kr. Useless, and I look at it anyway.
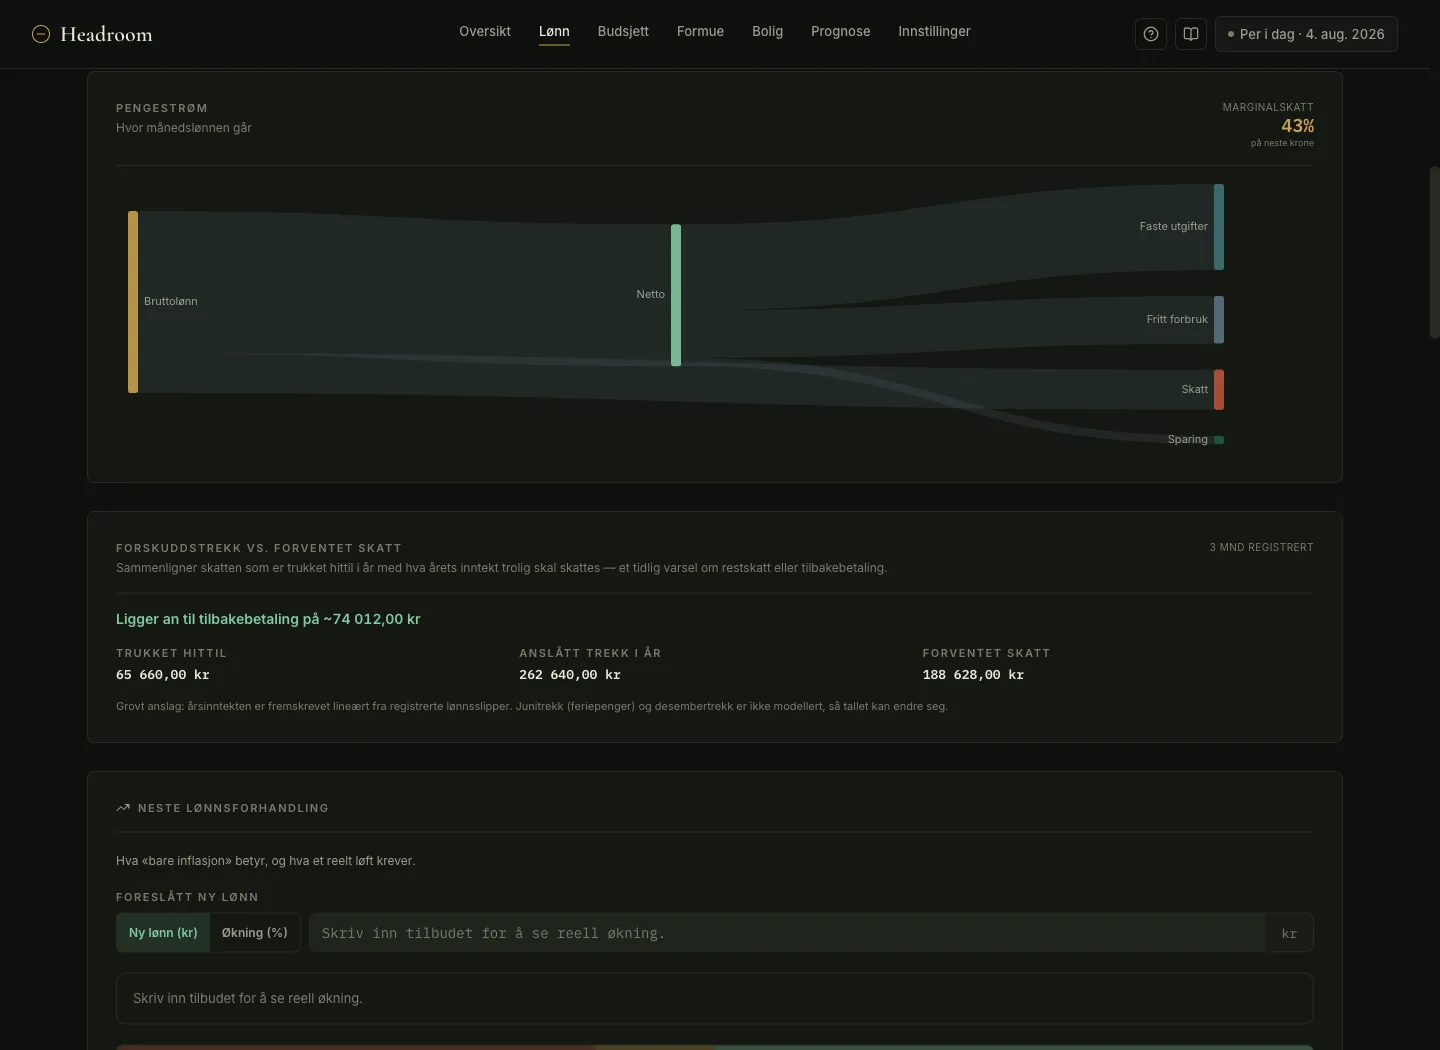
The same page traces one month from gross to what is genuinely free, with the marginal rate on the next krone in the corner. 43% is what an extra shift is really worth.

It also runs your withholding against what the year will actually be taxed. Three payslips in, the demo is heading for a 74 012 refund, which is money the state is holding for you until June.
The Month#
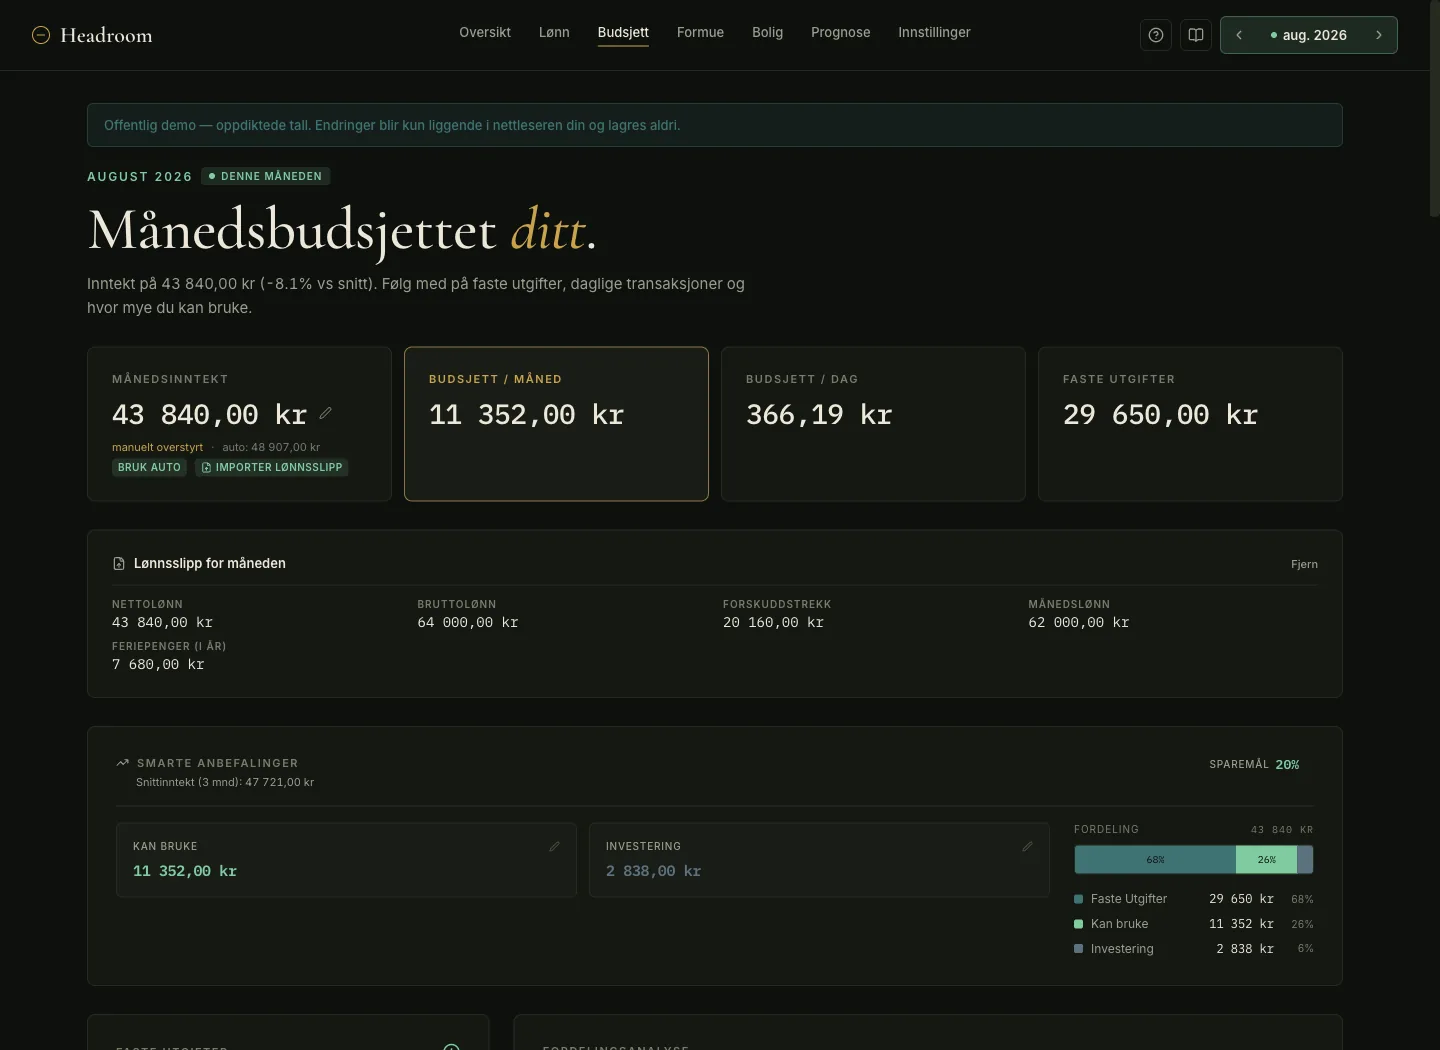
Income at the top, typed, derived from your salary entries, or lifted out of a payslip PDF that is read in your browser and never uploaded. In the demo it picked up 43 840 net, 64 000 gross, 20 160 withheld and 7 680 of holiday pay accrued, straight off the document.
Only Visma payslips parse today. Send me one from whatever your company uses, numbers blanked out, or open a PR with the parser, and we get it in fast.
Fixed expenses come off that, and what remains splits before you spend rather than after. Set 20% and it reserves 2 838 for investment off the top, then tells you what is genuinely free. Saving whatever survives the month is how people save nothing.
So you get three numbers on the day the money lands. Fixed costs of 29 650, then 11 352 free this month, then 366 kr a day. Per day is the one you use, because “you have 11 000 left” on the 3rd and on the 27th are different sentences.
Because the target is a share and not an amount, a month with on-call pay and an ordinary month both put the same percentage aside. The extra does not quietly turn into spending money, and a thin month does not break the target. That is the part that changed my own savings rate, because my months vary by a lot.
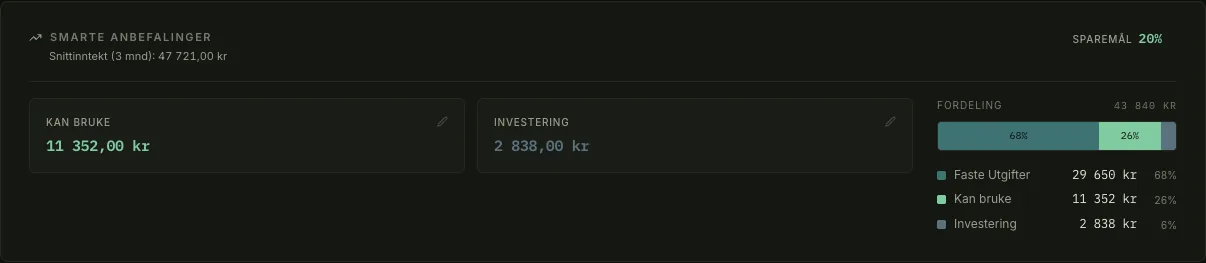
The 2 838 stays a target until something moves it. Each savings line takes a fixed amount, a share, or the rest of the target, and points it at one of your accounts.
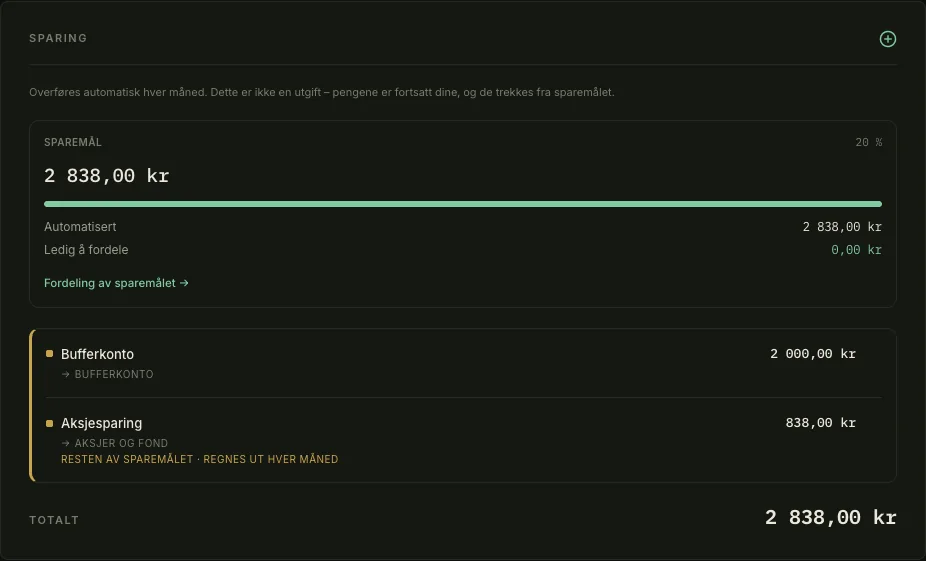
Mine puts 2 000 in the buffer account and sends what is left to stocks and funds. The remainder line recalculates every month, so when the target moves with the income it is a share of, the extra lands in funds without me editing anything. The two lines still add up to the target exactly.
Savings is not an expense here. It comes off the savings target rather than off what you can spend, and each month it moves the balance on the account you picked. The buffer grows, the fund account grows, and the goals on the dashboard read those balances, so the month each goal lands in moves on its own.
Pausing a line keeps it in the budget and stops the balance moving. Restart it and it resumes from the current month rather than backfilling the months it sat out. Catching up would put money in the app that never arrived in the account.
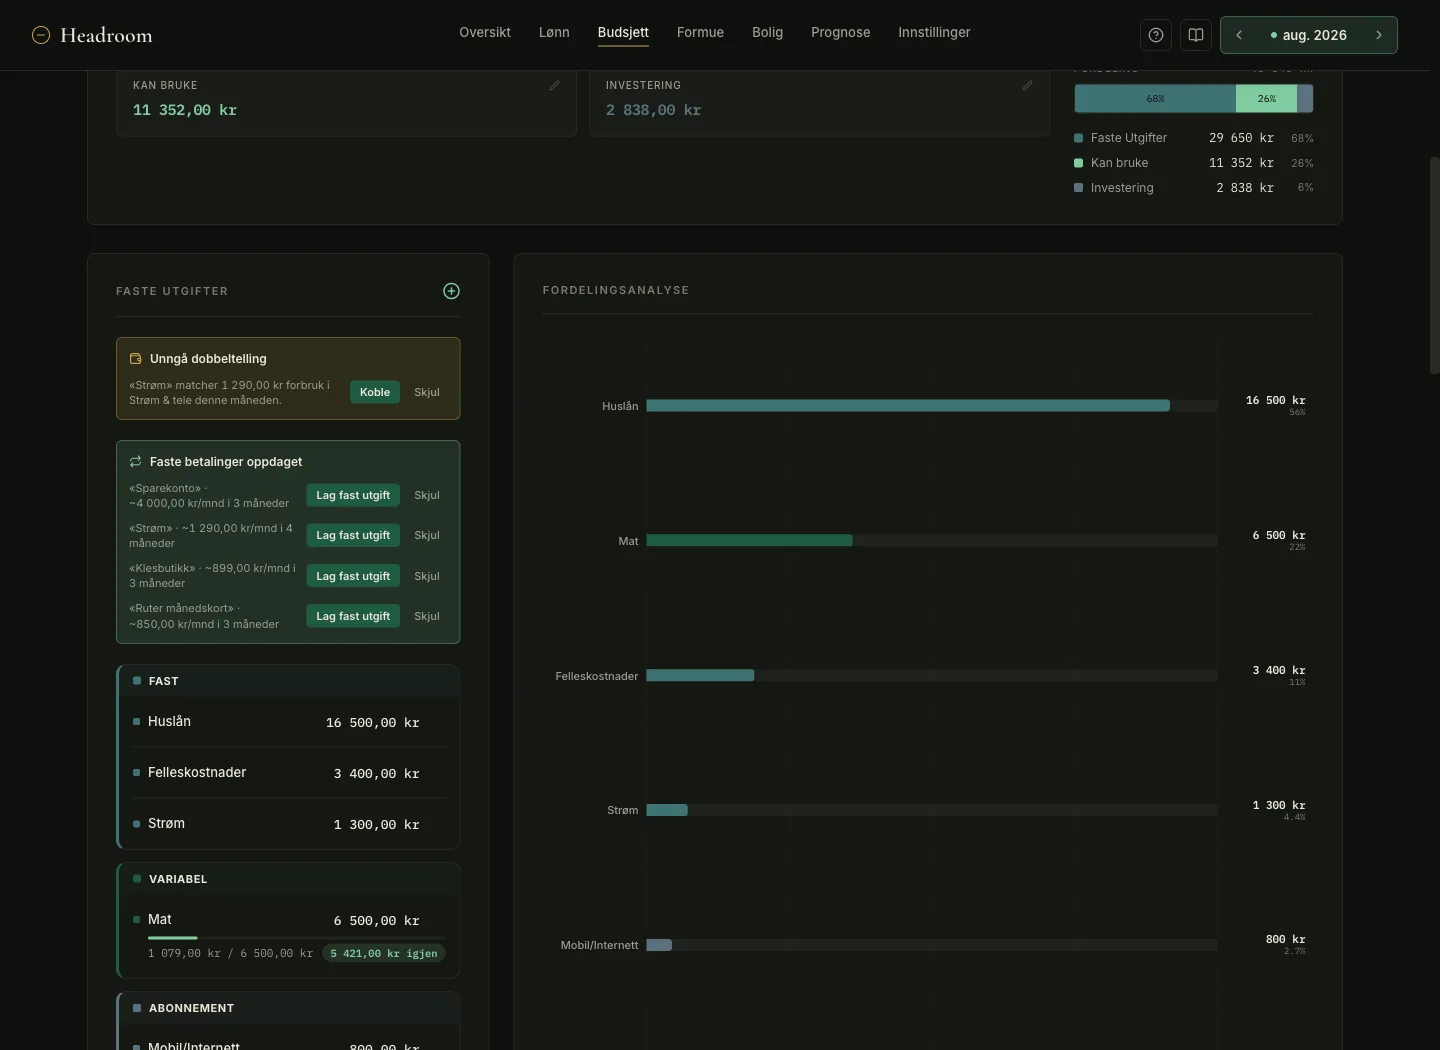
Transactions are typed in, or they come from your banks. That connection is opt-in and runs on open banking through Enable Banking, a free account you make yourself and authorise one bank at a time. Mine pulls Handelsbanken for salary and everyday spending, plus two credit cards, one from Bank Norwegian and one from Morrow Bank.
One view with every card and account in it is the thing I wanted for years. Fixed expenses map against that feed, and your own rules decide how anything unusual is counted.
It links a fixed expense to its matching transaction so a bill is not counted twice, and it promotes the repeated payments it finds, which is how the forgotten subscription surfaces. Rename a transaction or fix its category, tick remember, and every match in every month gets the same treatment.
Transfer detection is the one I did not expect to need. Moving 10 000 to your own savings account is not spending, but a bank feed cannot tell, and counting it ruins both the budget and the savings rate. It also warns about the way that goes wrong. Net out a credit card bill without importing the card’s own transactions, and everything you spent on that card disappears.
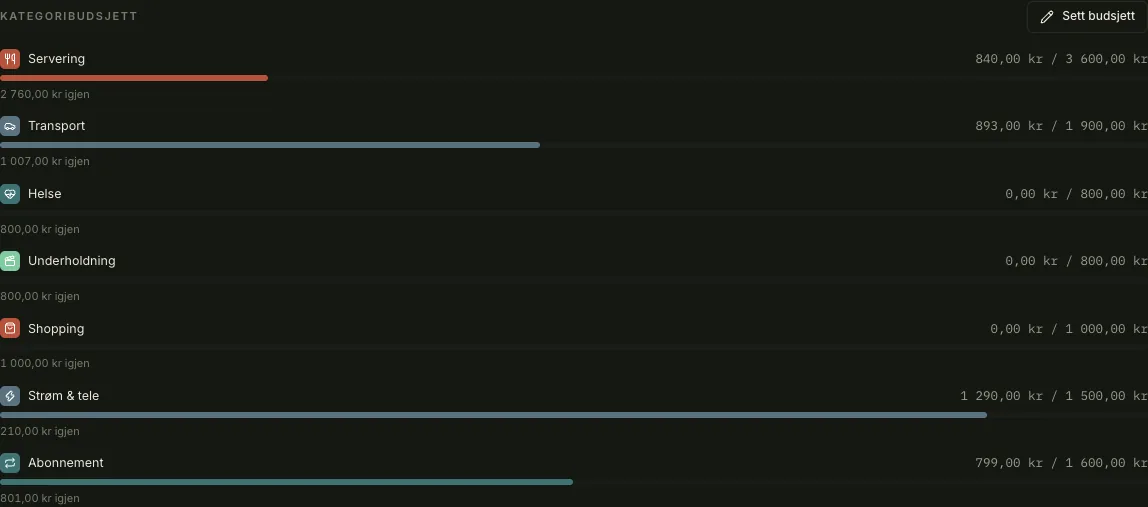
Under all that, a budget per category, spend per account per month, a search across every transaction you have, bulk category changes, and a nudge when the savings rate has been under target for months.
What You Are Worth After Tax#
Before I bought my apartment I could not answer a simple question. How much did I actually have to put down? The money sat in a share savings account at Nordnet, in BSU, in ordinary savings and in crypto, and adding those balances together gives you a number you do not really have.
A portfolio of 285 000 with 62 000 of unrealised gain is not worth 285 000. Sell it and 37.84% of the gain goes to tax, so the honest figure is 261 539.
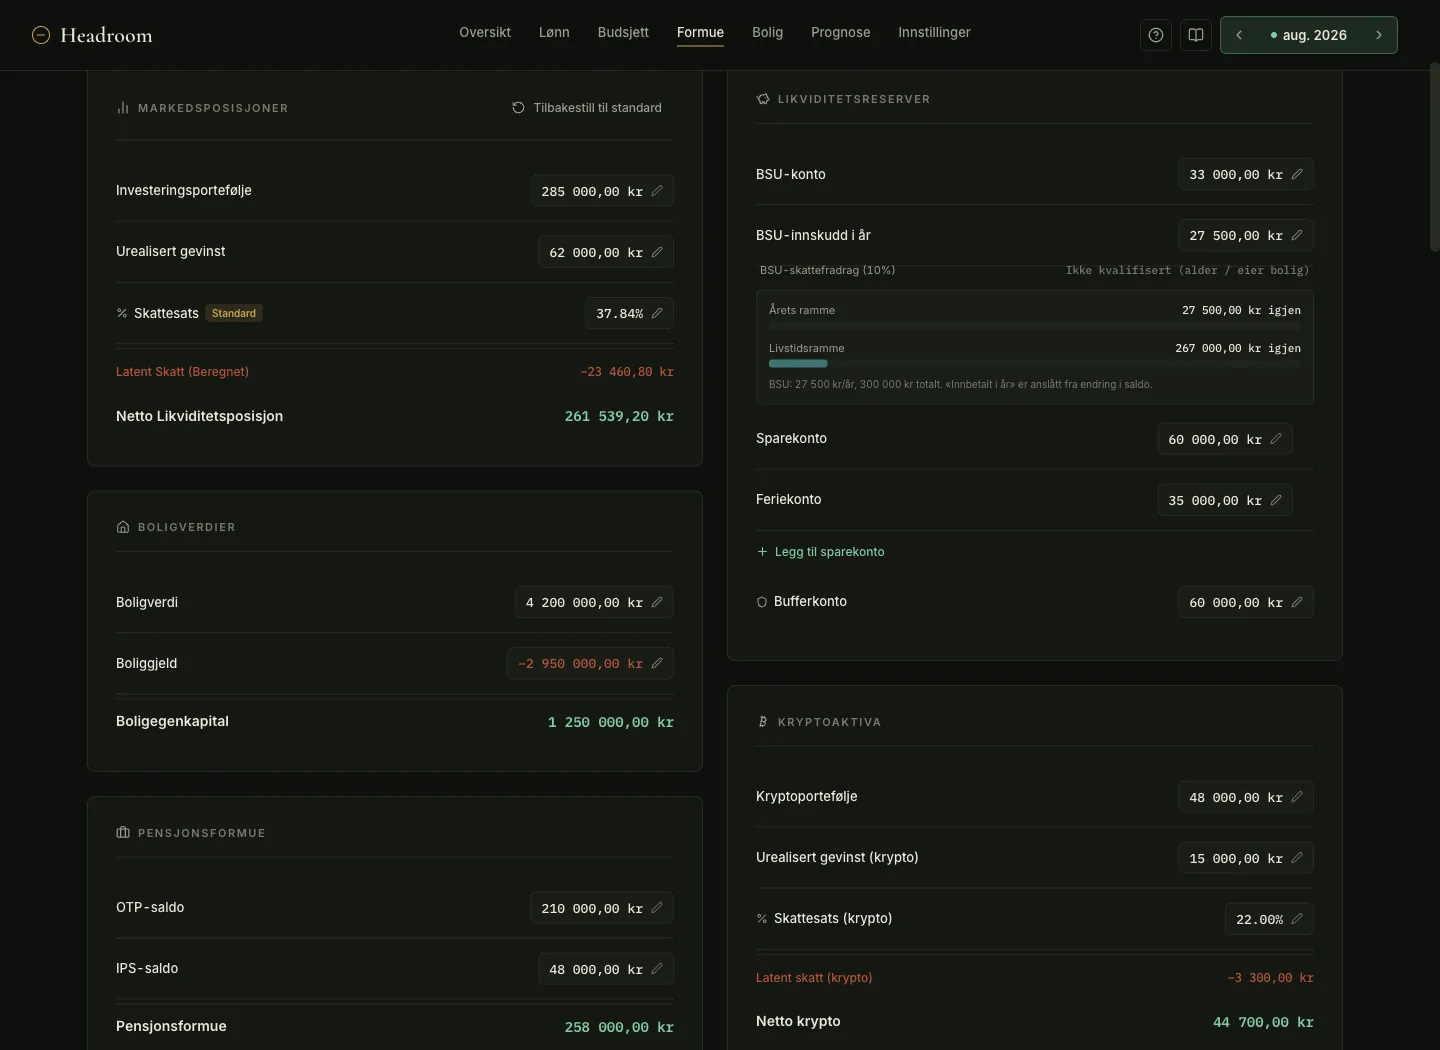
So the page deducts it. Crypto gets the same treatment at 22%. Unpopular way to display a portfolio. Correct one.
The rest of the page is everything you own, held apart on purpose rather than summed into one reassuring number. The portfolio, net of that latent tax. Property at 4 200 000 against a 2 950 000 mortgage, so 1 250 000 of equity you cannot spend. Liquidity, meaning what you can reach this week, with BSU next to it and both allowances tracked. Pension, kept out of the liquid total because employer and private schemes are real money that is not yours yet. And crypto, taxed like the rest.
On the other side of the sheet, credit frames count at their full limit rather than their balance, the way a bank counts them. An unused 100 000 card is 100 000 of debt in that conversation.
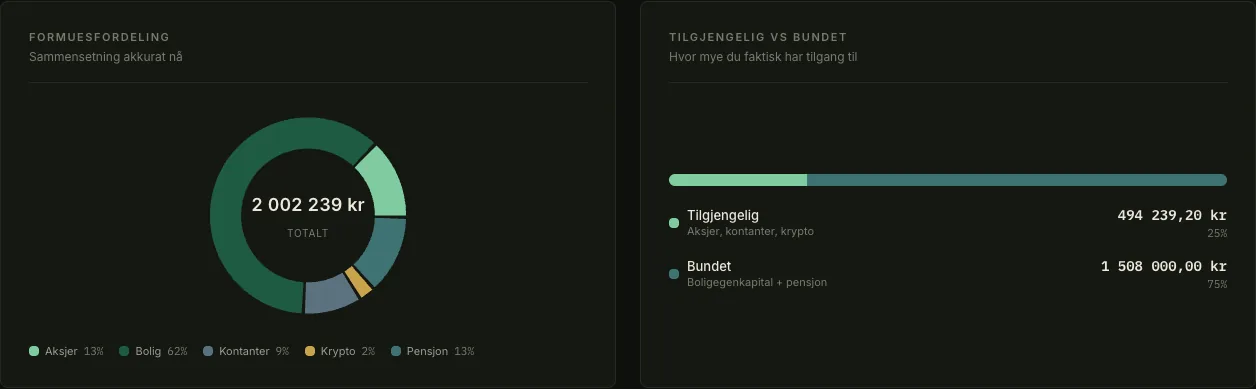
Under the balance sheet, where the money actually is. 62% property, 13% stocks, 13% pension, and the bar beside it splitting what you can reach from what you cannot. 494 239 available against 1 508 000 locked in home equity and pension is a different financial life from the same total held in funds.
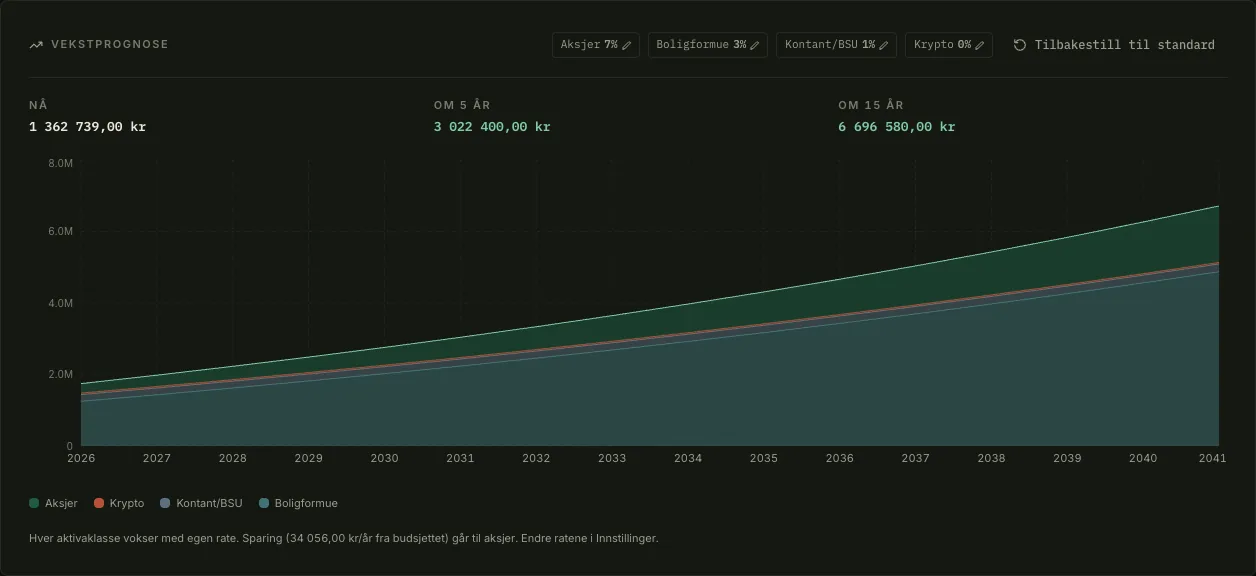
The projection runs those same assets to now, to five years and to fifteen. Each class grows at its own rate, 7% on stocks against 3% on the house and 1% on cash, rather than one blended number smeared over everything, and the 34 056 a year your budget sets aside goes into stocks as it goes. Change a rate at the top and the whole thing redraws.
Nothing here is typed twice. The property value and the loan come off the housing page, the monthly savings come from the budget, and the raise assumption comes from the salary log. Change the mortgage on one tab and the equity here, the projection underneath and the forecast all move with it.
One Home, One Loan#
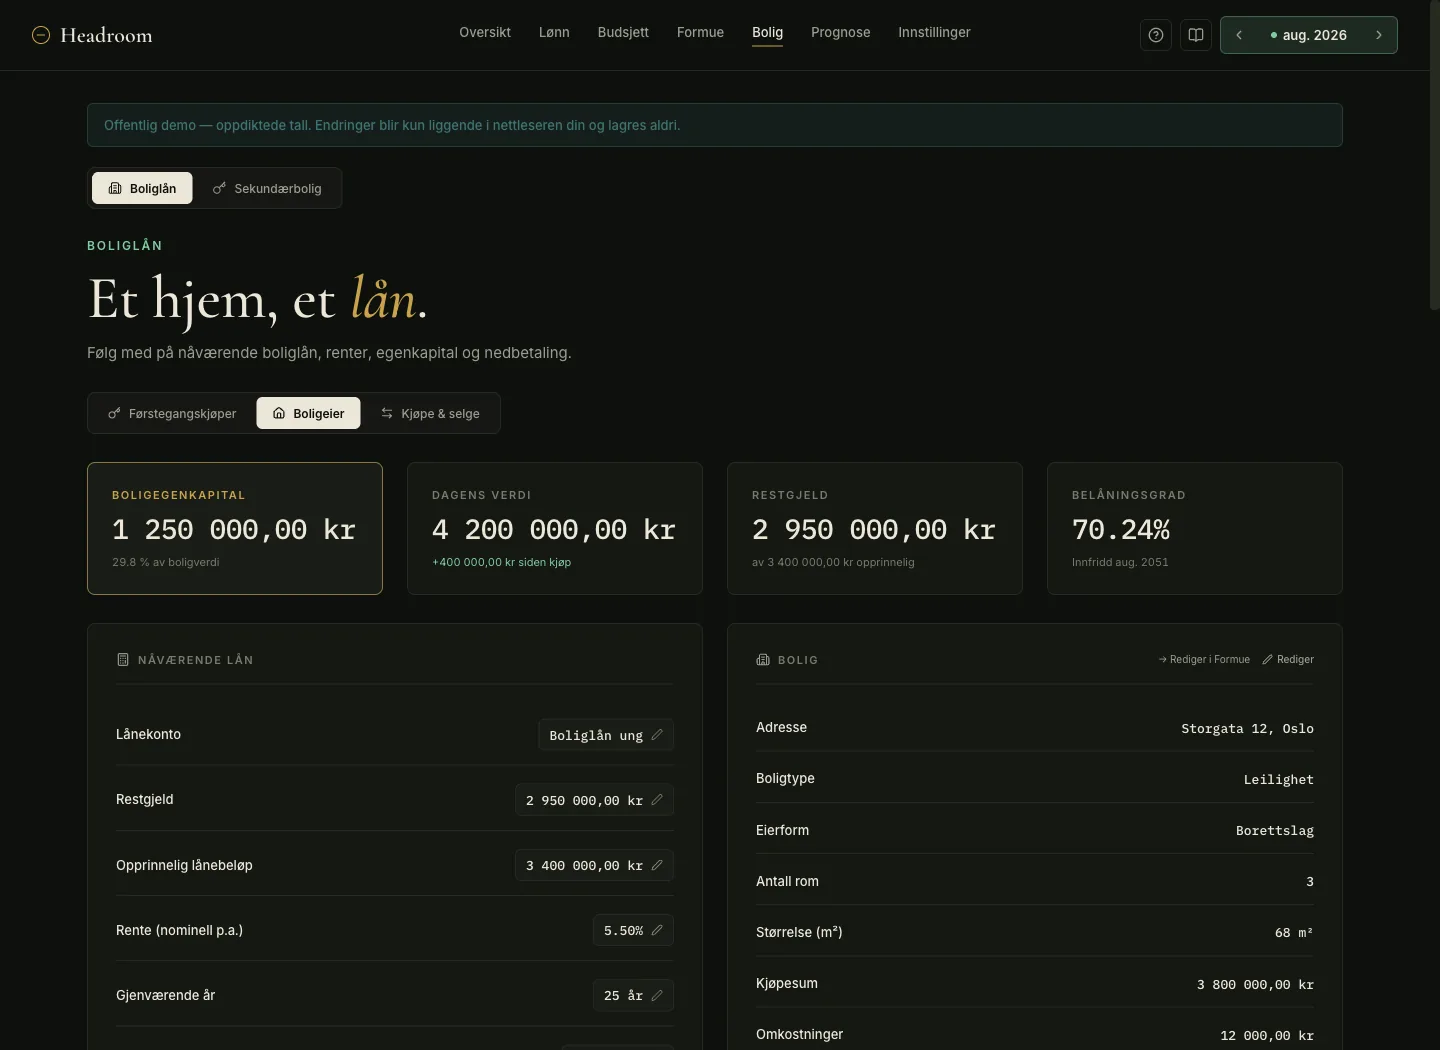
Equity, value, debt and loan to value at the top, then the loan itself.
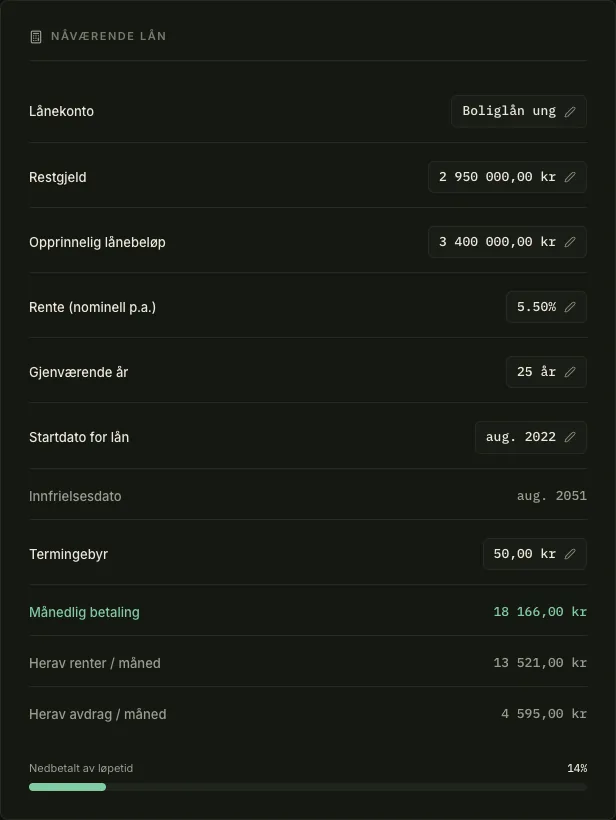
The monthly payment is 18 166 kr, of which 13 521 is interest and 4 595 is repayment. Seeing that written down is educational in a way your bank’s app avoids being. Underneath it, 14% of the term is done, and the payoff date is August 2051.
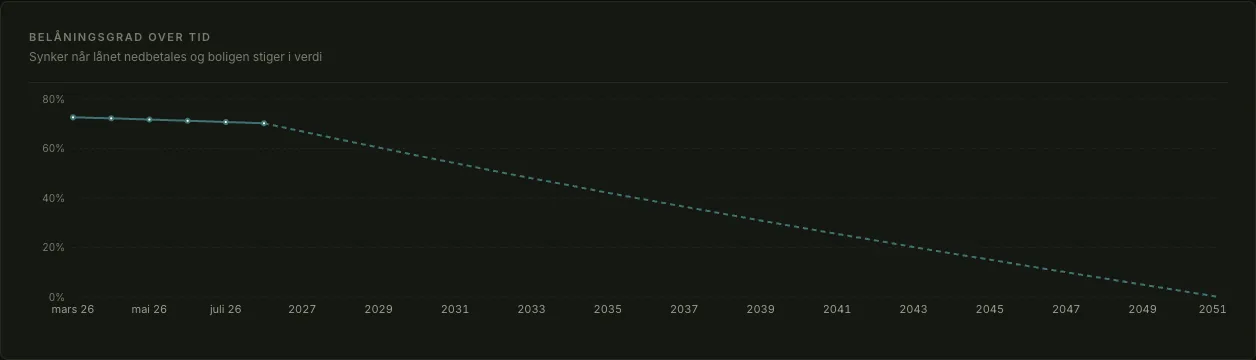
Loan to value falls from both ends at once, as you pay down and the property drifts up. Solid line where months are recorded, dashed where it is projected.
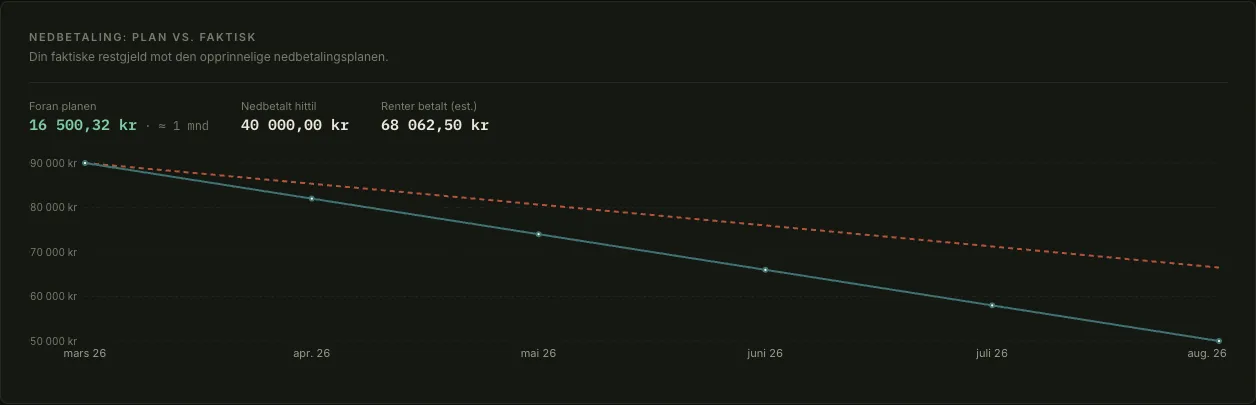
Plan against actual is the one that rewards paying extra. 16 500 ahead of the original schedule is about one month off the end, with 68 062 of interest paid so far sitting right next to it.
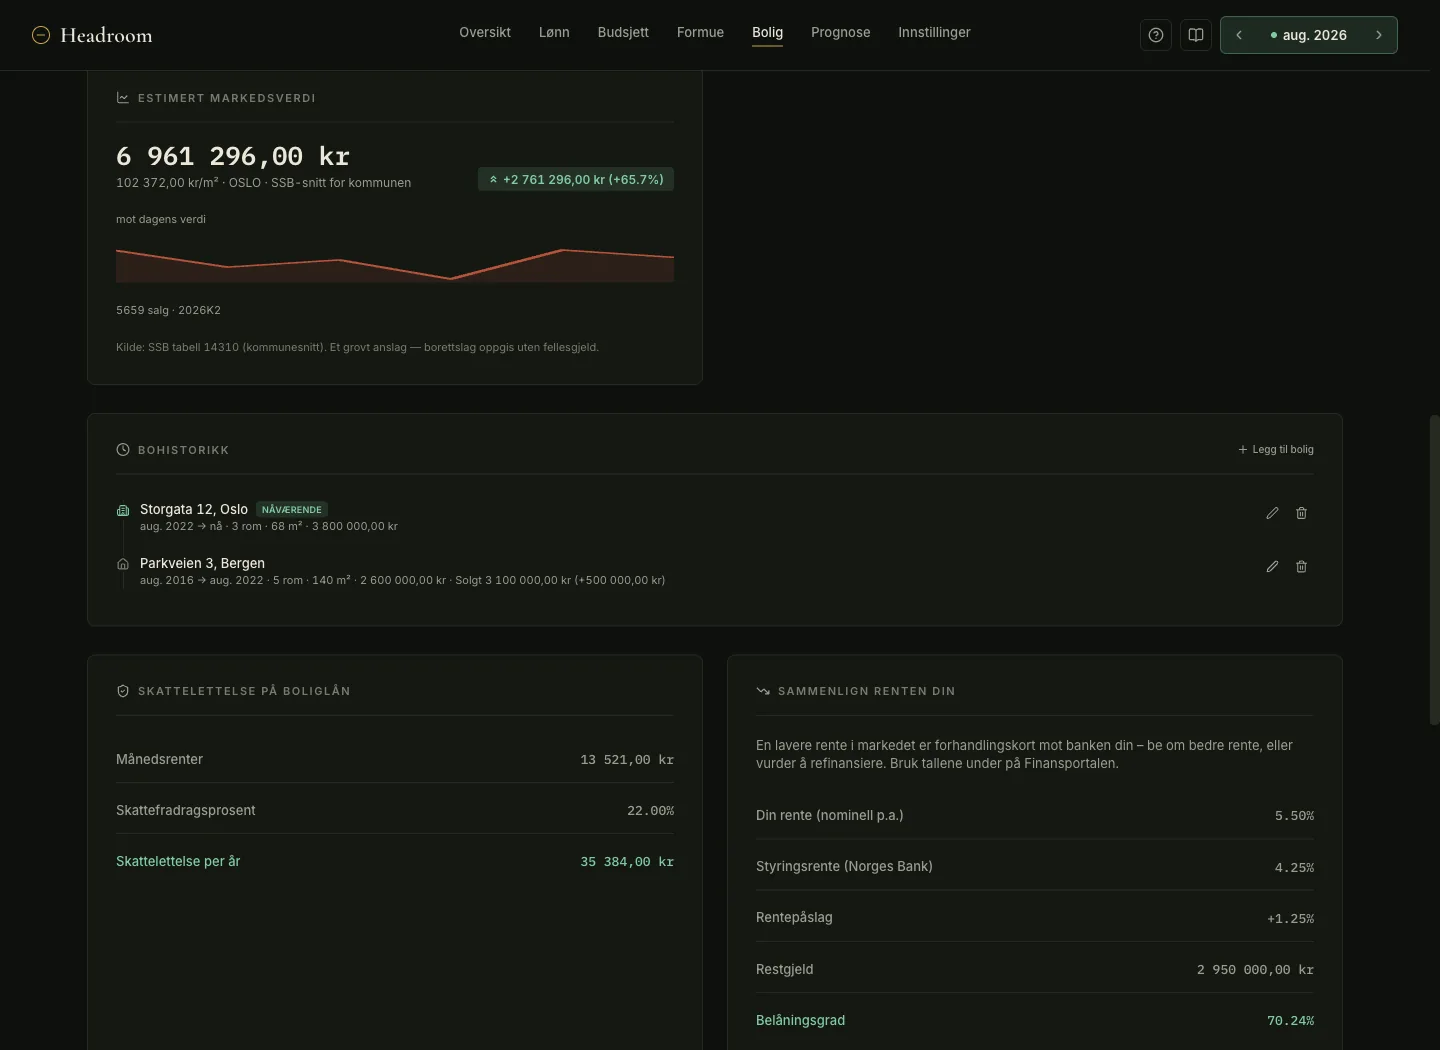
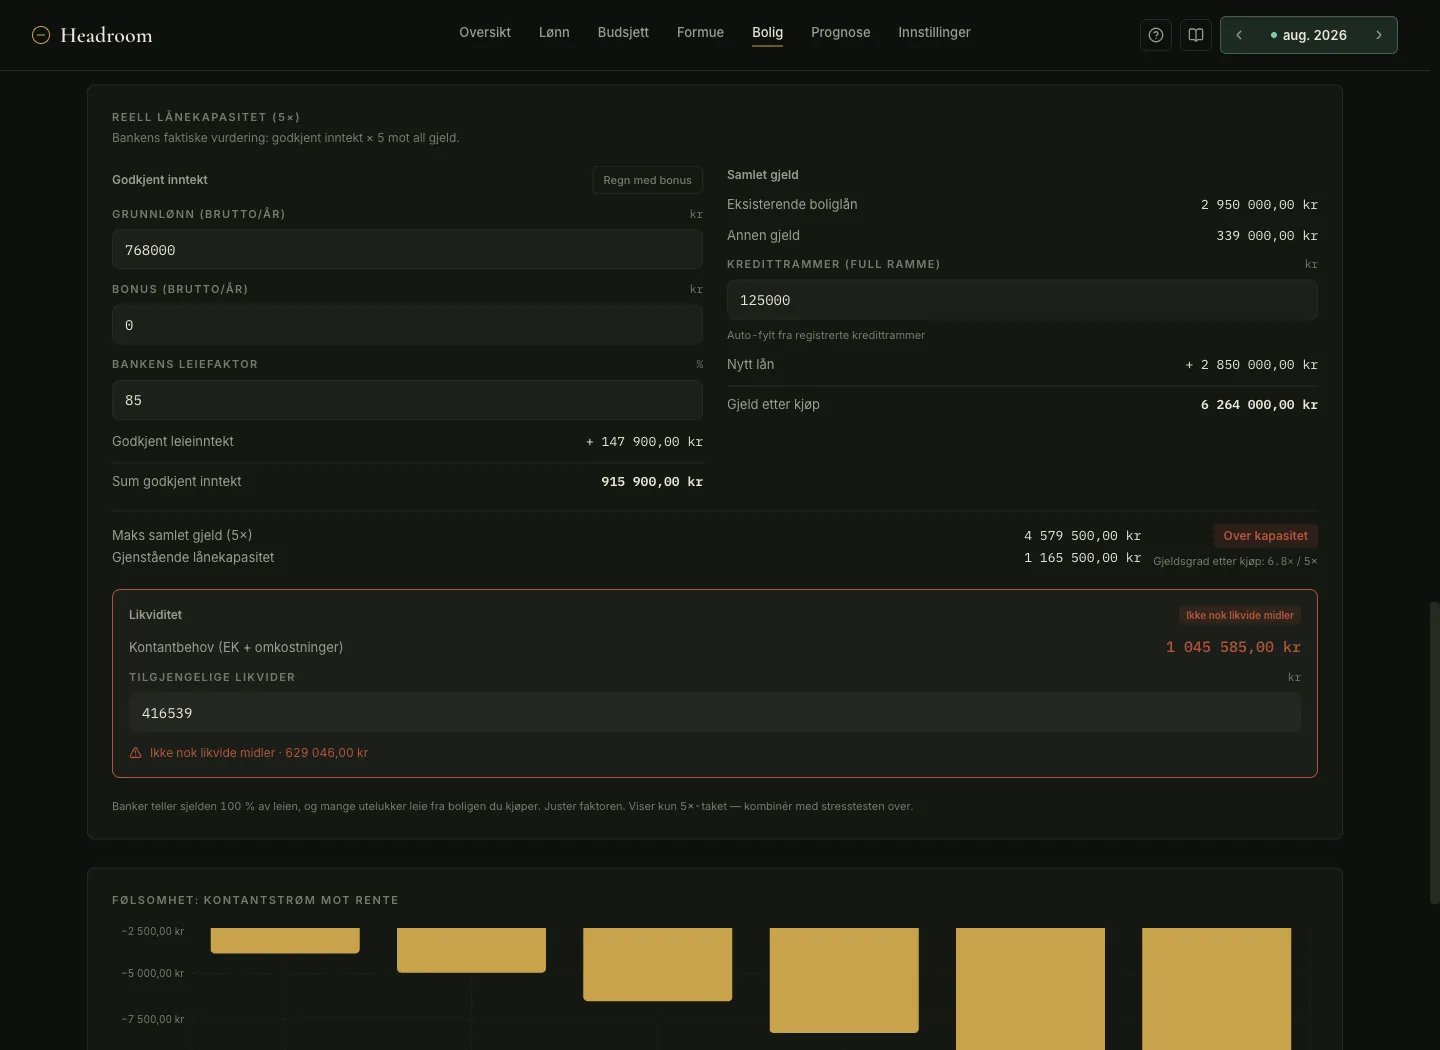
A market estimate comes from SSB, your rate sits next to the Norges Bank policy rate, and the second home panel tells you what the bank will say. In the demo that is over capacity and 629 046 kr short.
What You Cost#
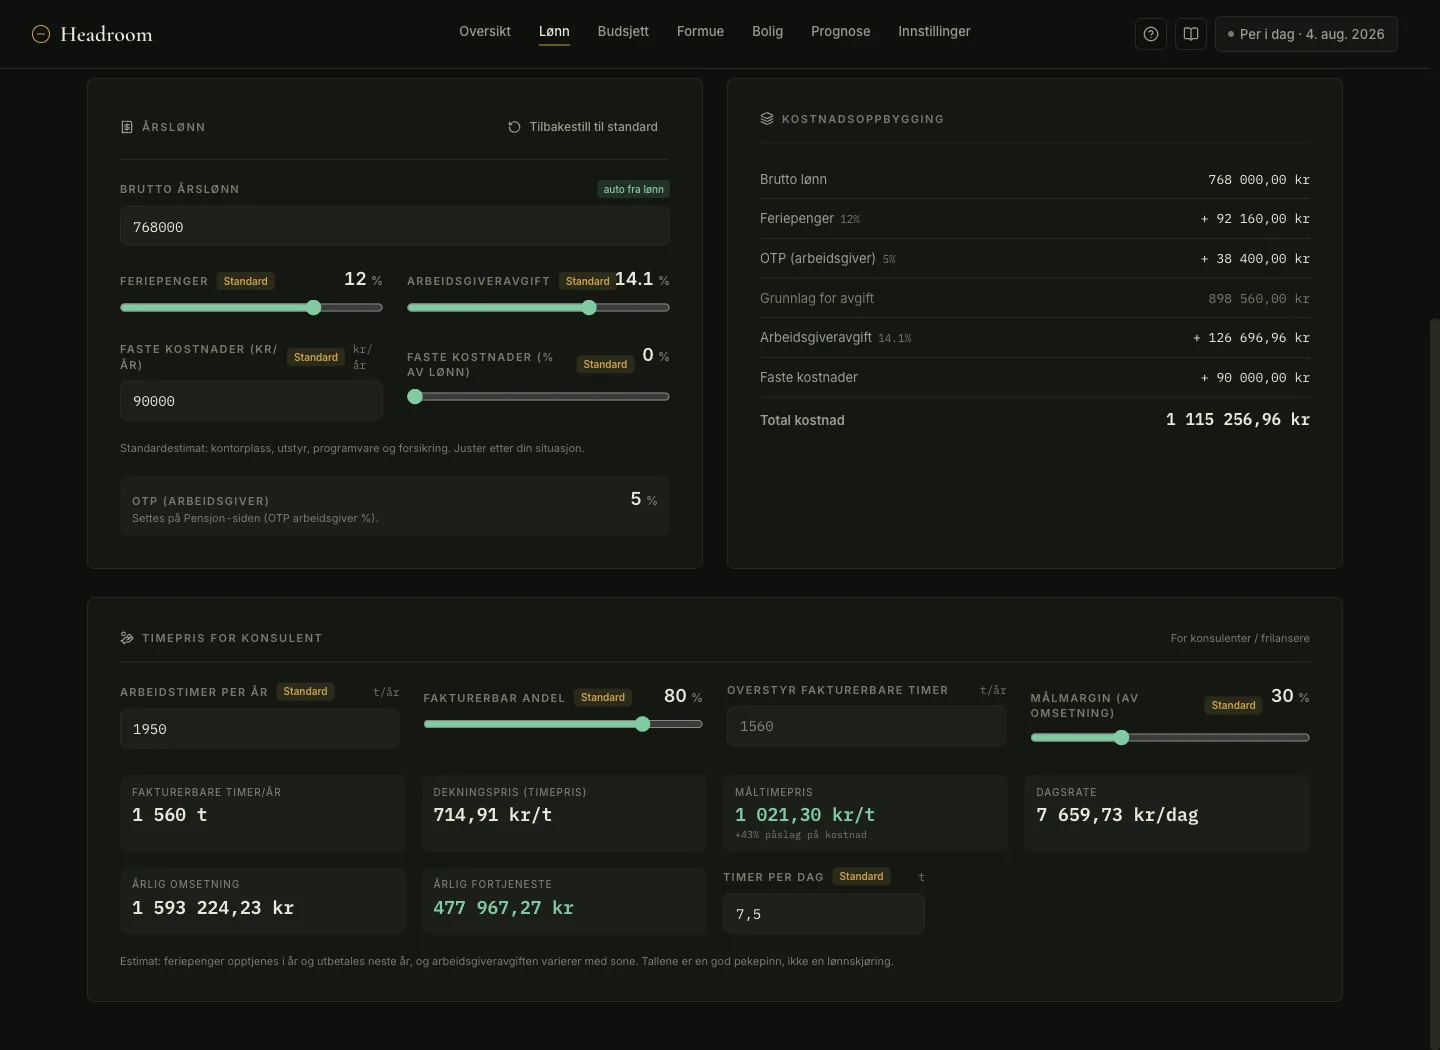
A contract of 768 000 costs 1 115 257 once holiday pay, employer pension, employer’s tax, a desk and a laptop are on it. Worth knowing before you ask for 30 000 more, because you are asking for 43 000. The page then divides that by the 1 560 hours anyone can actually invoice.
The Forecast#
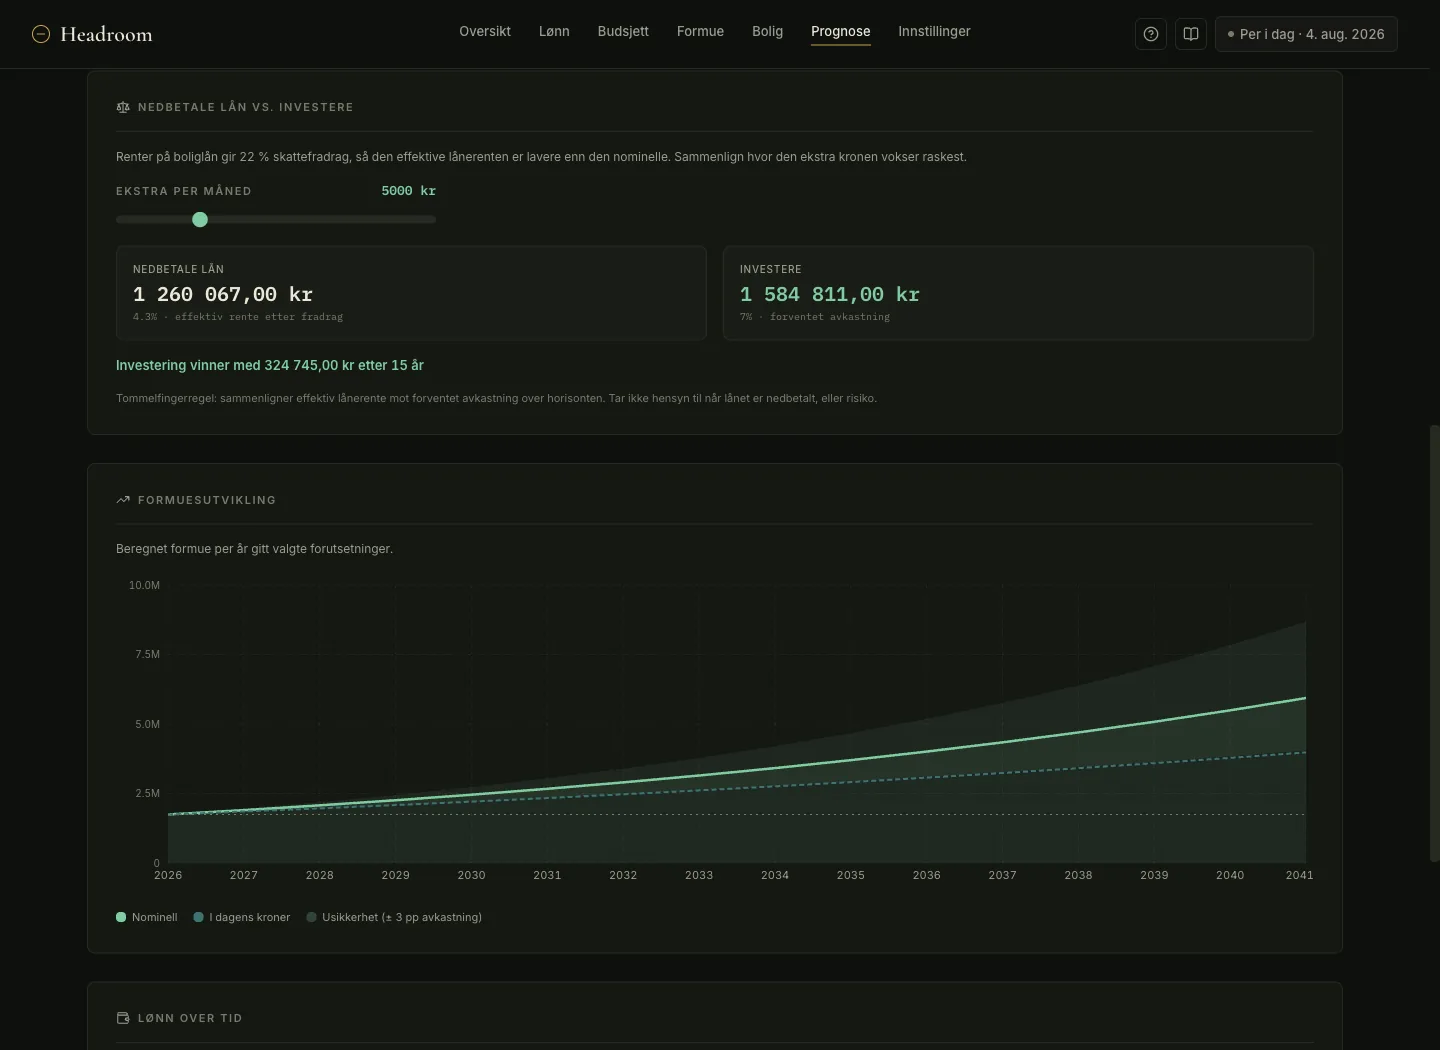
Everything above feeds this one. Nominal against today’s kroner, with a band at plus or minus three points of return, because a single confident line fifteen years out is a lie told with a chart library. Prepay against invest runs an extra 5 000 a month both ways, and there is a financial independence year and a two-scenario compare.
Pension and the Year#
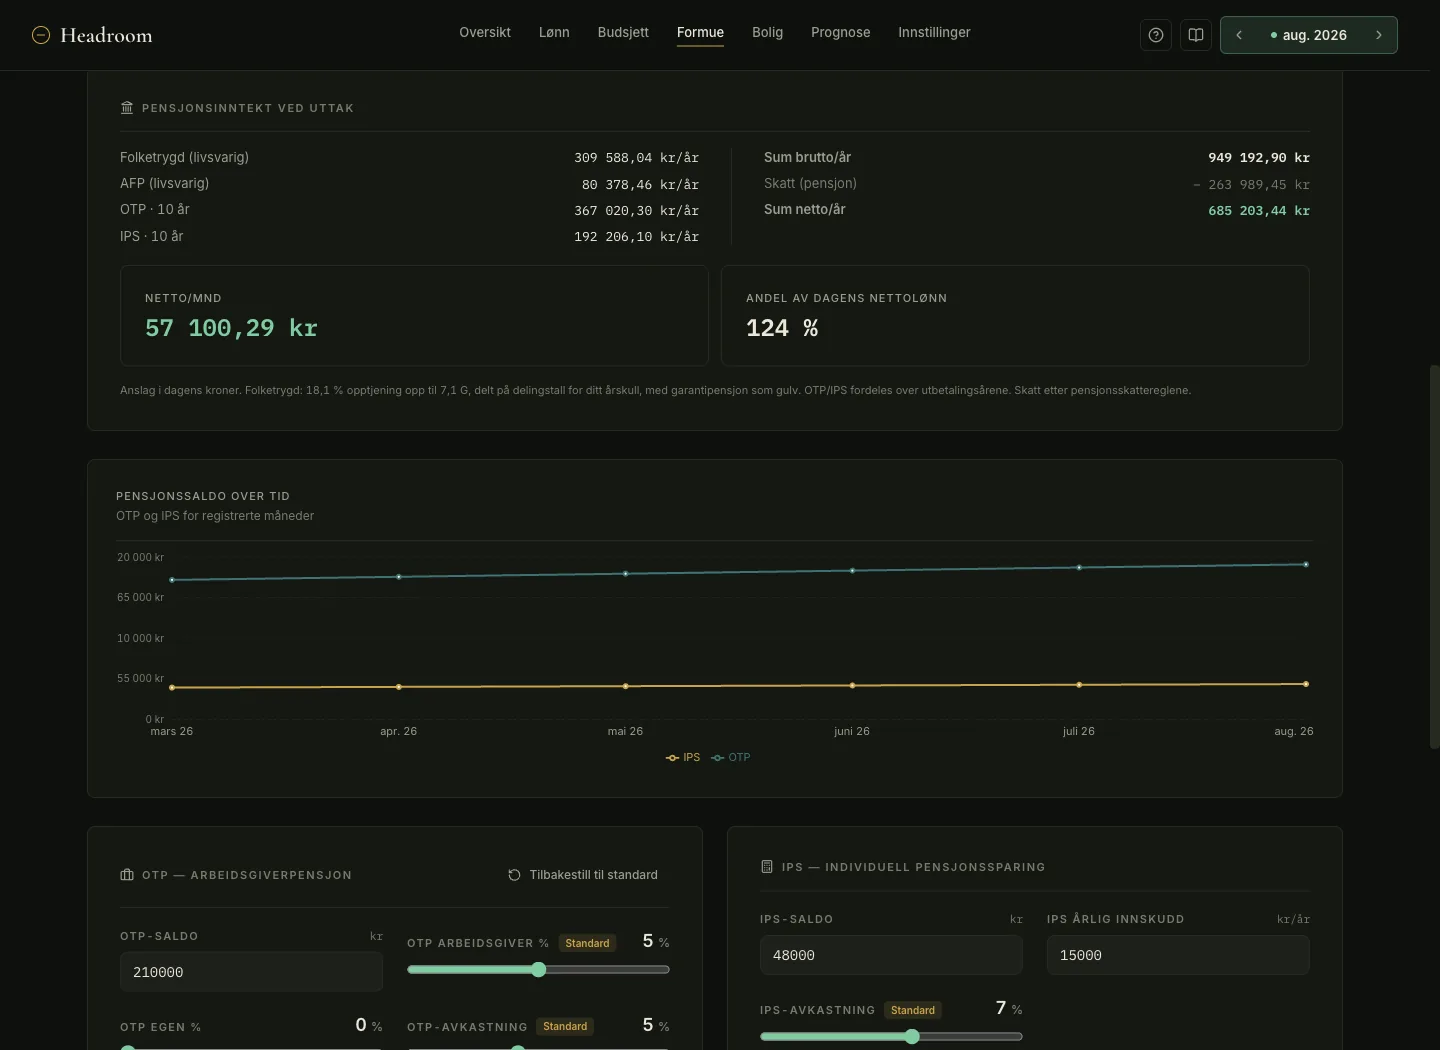
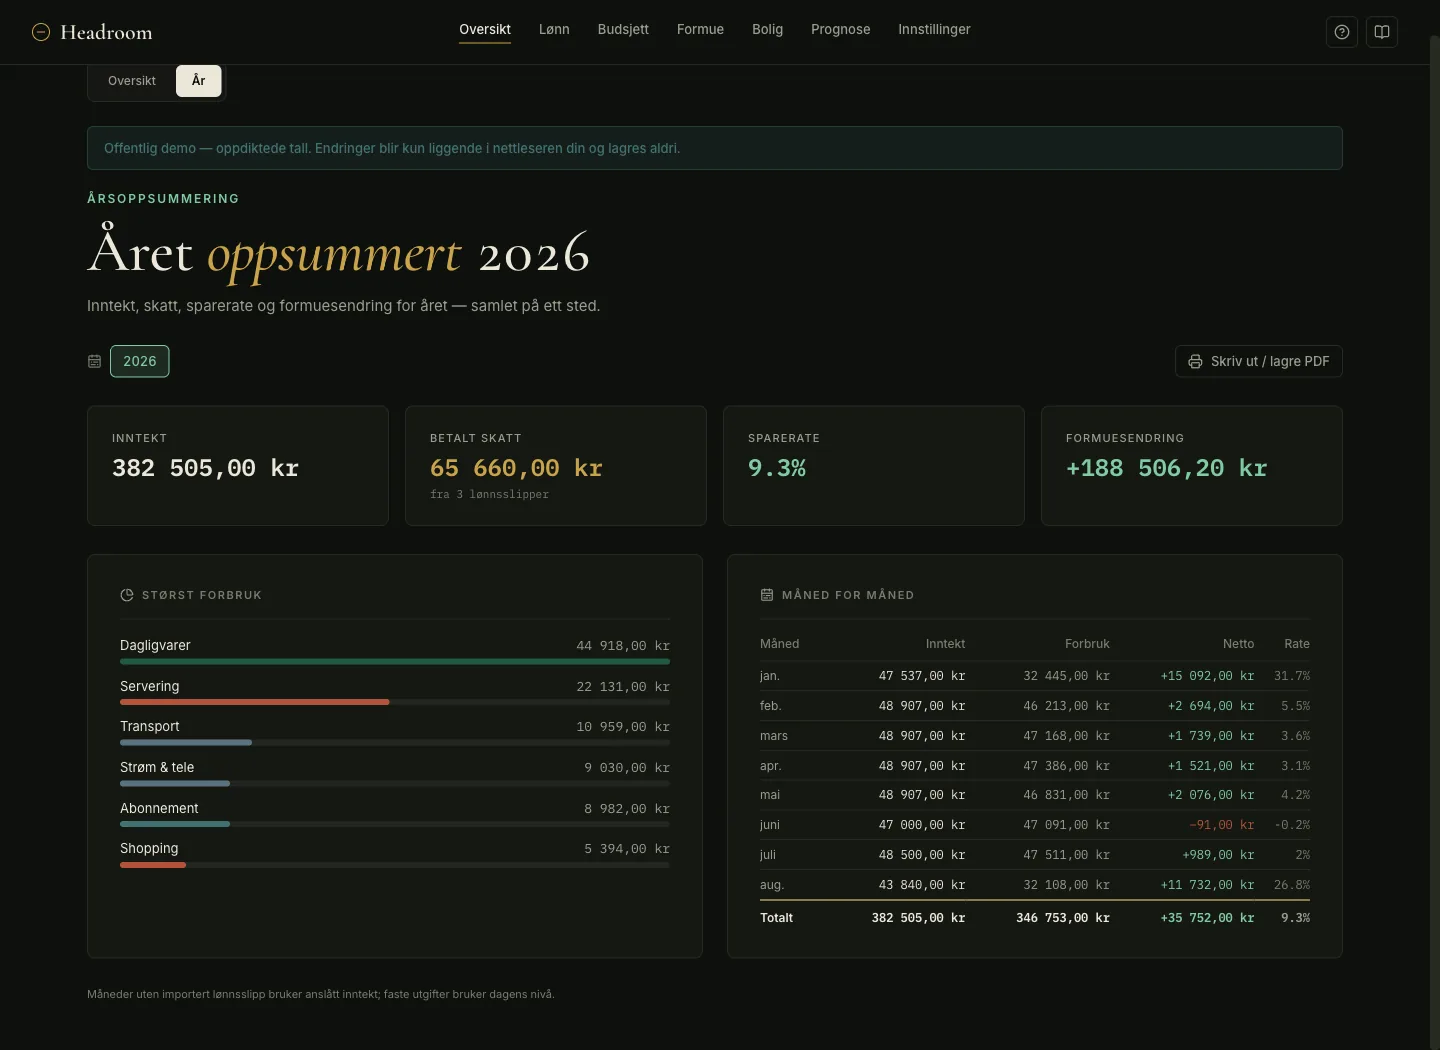
Pension folds the state pension and your employer and private schemes into what lands per month after tax. The year page prints to PDF, which is what people want from it once a year.
It Works on a Phone#
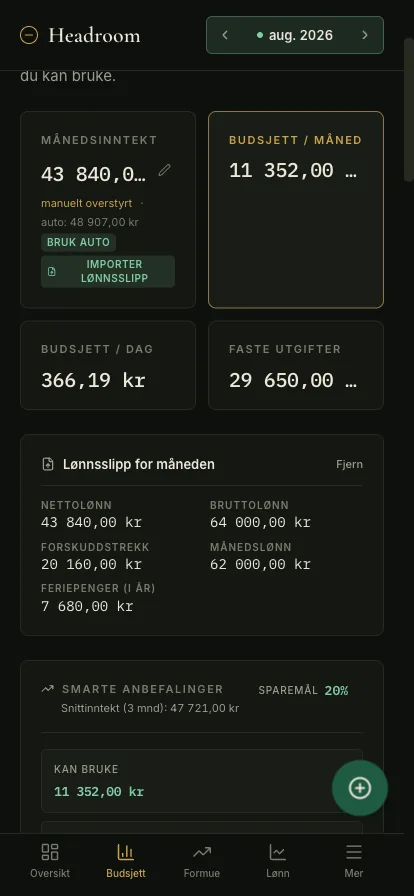
Full mobile layout, installable with its own icon. Behind Tailscale that is a budgeting app on your phone that never leaves your network.
Everything Else#
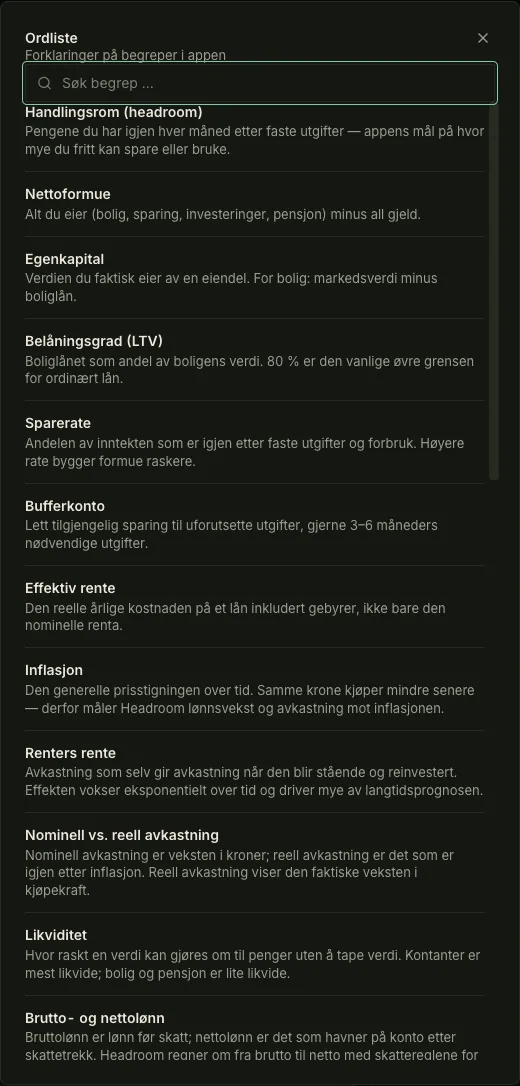
There is a glossary in the header. Headroom, loan to value, effective interest, nominal against real return, liquidity, gross against net. It is the school lesson from the top of this post, built into the app, and there is a setup guide next to it for the first run.
The housing page has three tabs I have not shown. First-time buyer, current owner, and buying and selling at the same time.
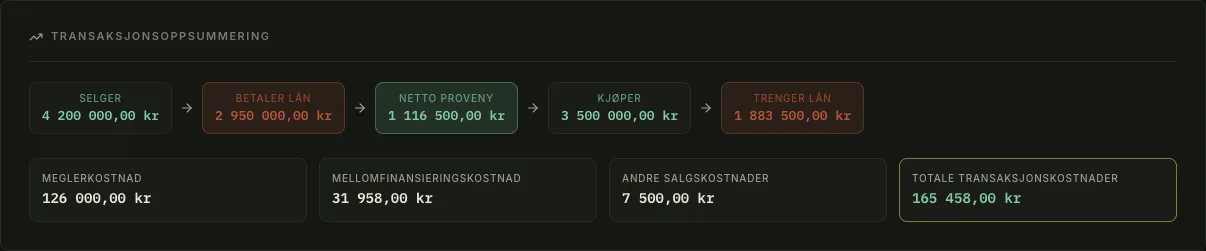
That last one chains the sale into the purchase. 4 200 000 out, the old loan repaid, 1 116 500 of proceeds against a 3 500 000 purchase, and 165 458 of costs that nobody budgets for, bridging finance included. The salary page compares what your employer withholds against what you will actually owe, so a refund or a bill is not a surprise in June. The budget page has category budgets, a six-month spending trend and recommendations from your own history.
Settings holds the rest. Your profile and payday, currency with a NOK to USD rate, language, region, the growth and savings assumptions every projection reads from, your own override rules, and a sample dataset to click through before you type anything real. There is also a free-text context box for the AI assistant, which is what stops it guessing at things it cannot read from the database.
Under the Hood#
If you came for what it does, you can stop here. The rest is how it runs.
Run It#
One command. No clone, no build, no config file.
docker run -d \
  --name headroom \
  -p 127.0.0.1:8080:3001 \
  -v headroom_data:/data \
  --restart unless-stopped \
  ghcr.io/mortennordbye/headroom:latest
Open http://localhost:8080. The 127.0.0.1 keeps it on loopback, and the volume survives restarts and upgrades.
There Is No Login#
Warning
Anyone who can reach the port can read and overwrite your entire financial picture. Do not put this on the open internet.
Two safe shapes. Loopback on a laptop, or a home server over WireGuard or Tailscale, which is also what makes the phone work. Without a tunnel, put an authenticating reverse proxy in front. The optional password and ALLOWED_HOSTS guard are extra depth, not the front door.
Where the Transactions Come From#
A bank fetch reaches back about 90 days, but nothing is dropped, so your history keeps growing on your own disk.
Fetched ~90 days
server/bank.js
Anything older is already in your database from an earlier sync.
Deduplicated
src/lib/bankDedup.ts
The same payment arrives twice, once pending and once booked. This stops your grocery bill doubling.
Categorised
src/lib/categorize.ts
Rules map a merchant to a category. Tune for a month, then stop thinking about it.
Labelled
src/lib/labelRules.ts
For what a category cannot express, like which of two shared costs was yours.
Transfers removed
src/lib/transferRules.ts
Money between your own accounts is not spending, and counting it ruins a budget.
Every rule there is a tested function in src/lib/ with a test file next to it, which is the only reason I trust the wealth page.
Your Data Stays Yours#
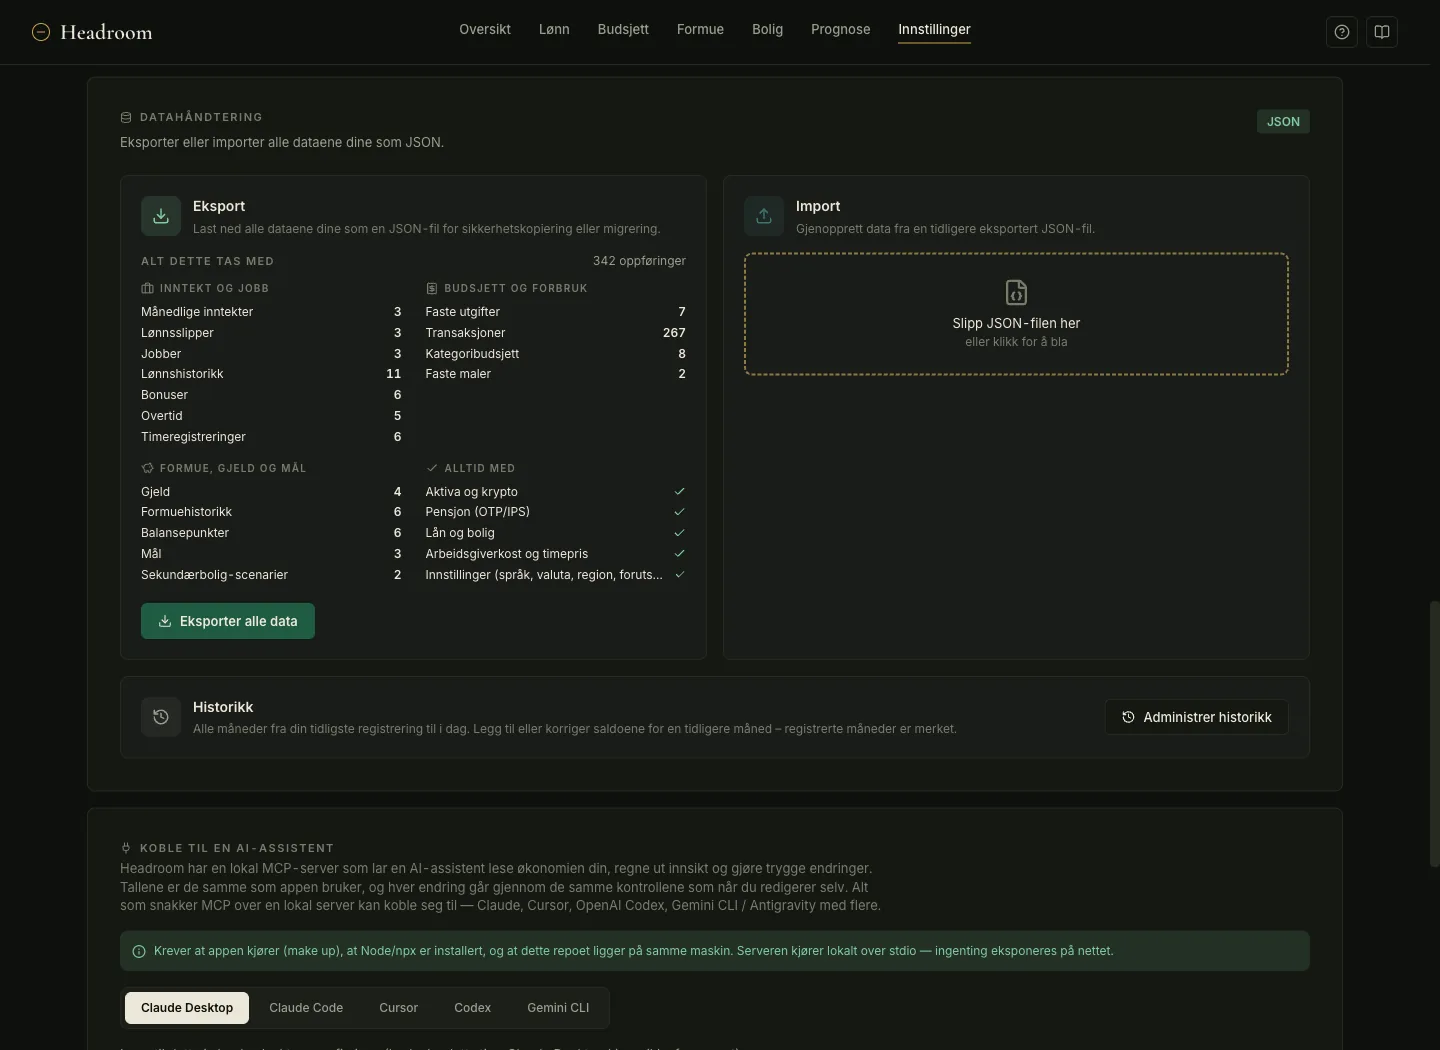
One JSON export holds everything, and the screen lists what that means rather than asking you to trust it. Import previews which sections to restore and takes a safety copy first. There is also a rotating SQLite snapshot and a make backup to the host.
Same screen wires up an AI assistant. The MCP server runs locally over stdio and reuses the app’s own tested math, so the numbers cannot drift.
make mcp-installHow the Public Demo Is Locked Down#
There is no login, and yet an instance of it sits on the public internet. That works because the public one is not really the app.
DEMO_MODE=1 refuses every non-GET under /api/, refuses the whole /api/bank/* namespace (its GETs are not safe reads, one proxies to Enable Banking on the instance’s own credentials), fills the client from a browser-generated dataset, and skips the background jobs. Enforced server-side in server/demo.js.
I did not want that to be the only thing between a stranger and a bank API. A CiliumNetworkPolicy sits under it, rolled out the way I put policies on the rest of the cluster. Audit mode with Hubble first, then default-deny.
Full file: k8s/talos/apps/headroom-demo/ciliumnetworkpolicy.yaml
egress:
    - toEndpoints:                              # DNS, so toFQDNs can resolve
        - matchLabels:
            "k8s:io.kubernetes.pod.namespace": kube-system
            "k8s:k8s-app": kube-dns
      toPorts:
        - ports: [{ port: "53", protocol: ANY }]
    - toFQDNs:
        - matchName: "data.ssb.no"          # <--- inflation, m² prices, wage stats
        - matchName: "data.norges-bank.no"  # <--- the policy rate
      toPorts:
        - ports: [{ port: "443", protocol: TCP }]
The important part is what is missing. Writing any egress rule makes egress deny-by-default for this pod, so those two hostnames are the only places it can reach. api.enablebanking.com is deliberately absent, so a regression in the demo gate alone cannot reach a bank.
Common Mistakes to Avoid#
Pointing a demo instance at your real volume
DEMO_MODE protects writes. GET /api/data still serves your finances to the internet. Separate instance, empty storage.
Assuming an update failed because nothing changed
It is a PWA and caches itself. Accept the prompt or hard-reload. It looks like a broken deploy and is not one.
Setting runAsUser on the pod
The entrypoint starts as root, fixes /data ownership, then drops to uid 1000. Starting non-root removes its ability to chown. Use fsGroup.
Treating a lagging public series as missing data
SSB publishes CPI with a lag. Reading that as “no data” hid a working feature for a month. Decide what a normal lag looks like, and keep it off the same code path as a real failure.
What’s Next?#
Uncertainty bands on the stacked projection charts, which needs a design decision rather than more code.
Final Thoughts#
I built this for myself, and the surprise was how much of the value sits in the maths rather than in the app around it.
Knowing what a decade of my own raises did against CPI changed what I say in February. That 1 560 of my 1 950 hours are the billable ones changed how I read a rate, and that 13 521 of an 18 166 payment is interest changed how I feel about paying extra.
You do not need Headroom for any of that. You need the numbers in front of you often enough that you stop guessing, and getting there should not cost a monthly fee. The manifests that run it are in the Homelab repo if you want the rest of the setup, and they reach the cluster the same way this blog does, through GitHub Actions and ArgoCD.
Headroom does the maths school skipped. The volume of a cone is still your problem.